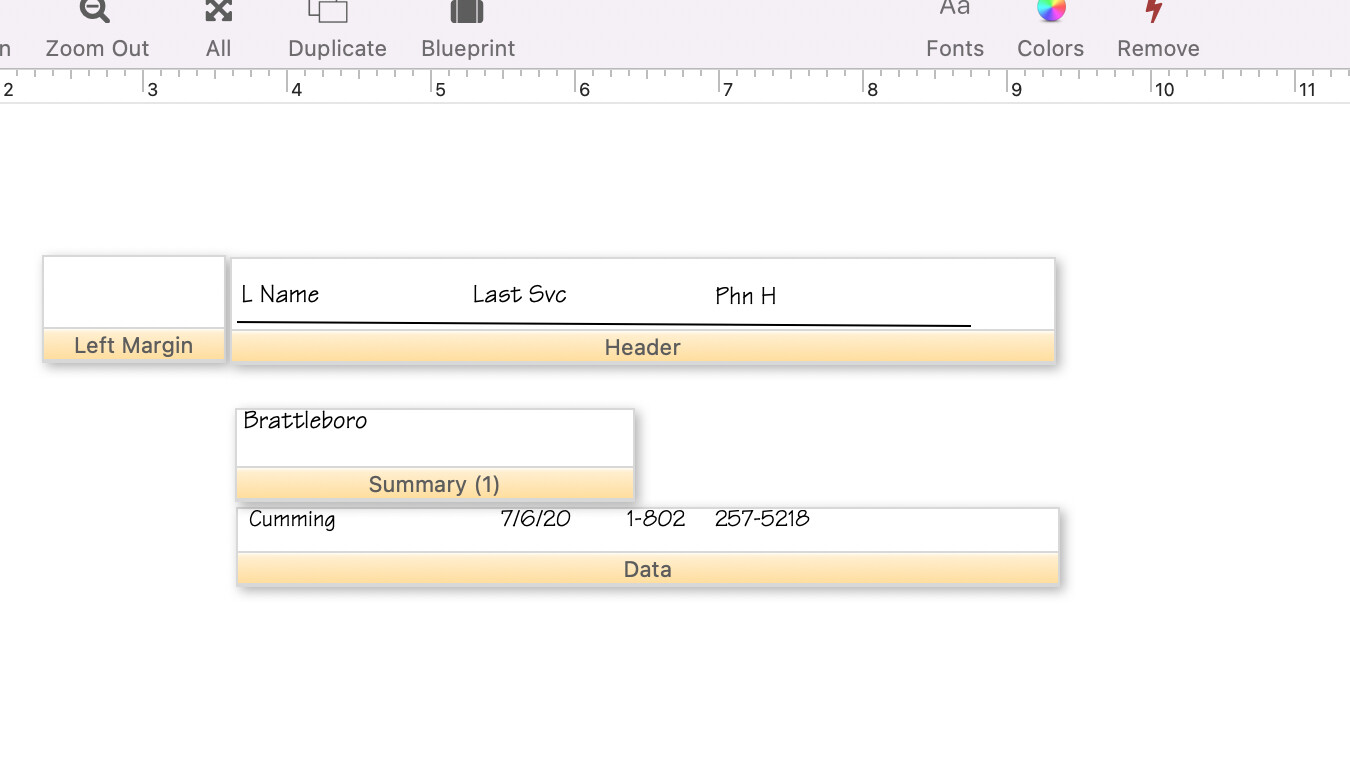
I’m working on some basic functionality here, in particular the View-as-List (the “new” report). I have a Summary Level 1 tile set up, the summary data shows up in Graphics Mode for the current record. However in Data Mode, the summary level formatting is blank and shows no sign that it’s implemented. The data sheet is correctly showing that this summary level is in place.
The View-as-List feature only works with Data and Header tiles. All other types of tiles work in printed reports, but not in View-as-List. In a View-as-List window, summary records are displayed using the Data tile.
Thanks for the comments, Jim. Actually a report is what I want, but in the Intensive Videos, there was no mention of reports, nor could I find them in the app’s menus.
I found “reports” in the Help File and I’m on my way.
Thanks again……
About report tiles, what is the “Group Header” report tile? Is that a way of labeling each of the categories that the data records have grouped into? I couldn’t find any such definition in the Help File.
That, or anything else you might want to appear above the group in your report. You might put column headers there, for example, if you want them to be repeated at the head of each group in a long report.
In a group header, text that changes from one group to the next, will be drawn or generated from data in the first record in the group.
If you follow the link above, it will take you directly to the subsection that discusses group headers.