Is it not possible to use a formula to create a chart? I’ve tried various degrees of building the chart formula with all or part in a variable, but it always displays an error with exactly what works if entered literally, which is also the exact content of the variable:
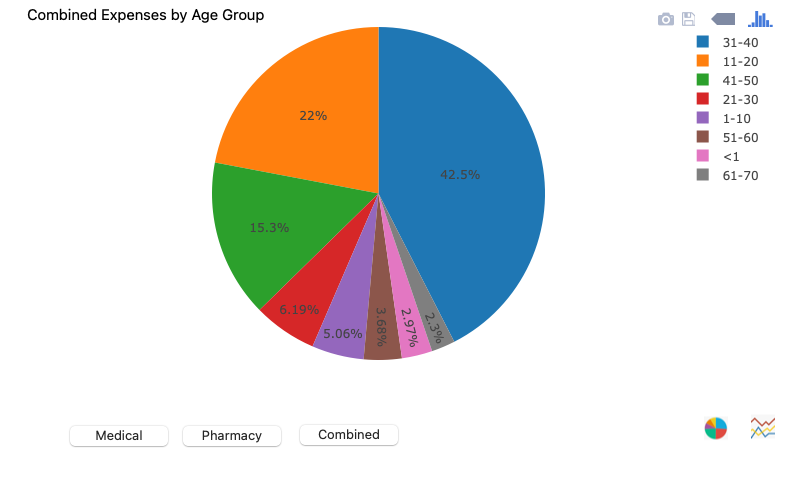
Web browser URL is malformed: chart(“Women,123;Men,131”,“chart”,“pie”)
A right-click on the WebBrowser object shows this as the value of the object, yet the error is displayed.
It can be updated by changing the Blueprint via the procedure.
Also, is there any way to set a WebBrowserObject so that its background is transparent and not opaque?
I’m guessing that perhaps by now you’ve already figured out why this doesn’t work. The only graphic object that allows a formula to be put into a variable is the Text Display object, and that is only when using the Evaluate Formula Twice option. The Web Browser object does not have this option (neither does any other kind of object).
You are passing the value
chart(“Women,123;Men,131”,“chart”,“pie”)
to the Web Browser object. That is not valid HTML, and it is not a valid URL. So the reported error message is exactly right.
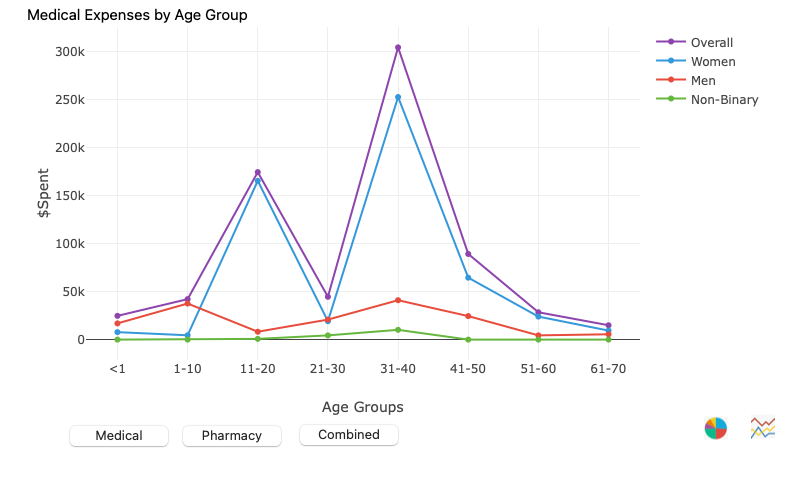
Yes, it works perfectly. Now I can have buttons representing a handful of variables already bearing calculated data. The buttons can change the type of chart and/or what it displays.
It’s also ideal for simply displaying the results of calculations versus values in the fields and cells.
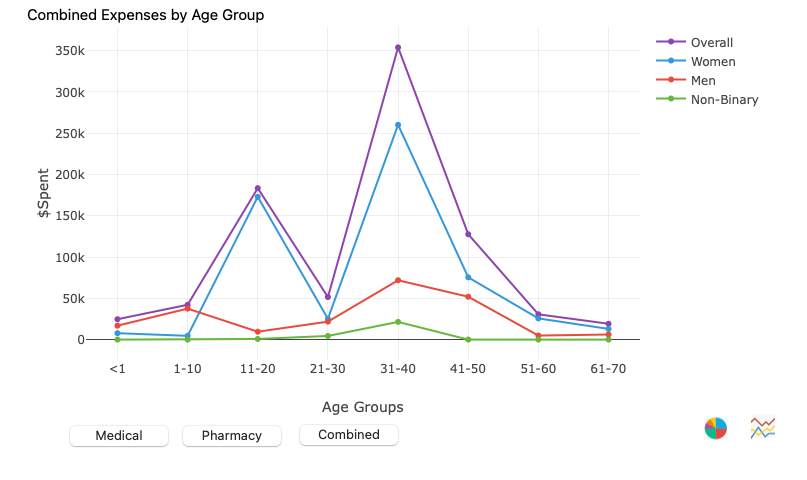
When I tried to use plotly-2.12.1.min.js to build other styles of plotly charts it was necessary to build an entire html page in a variable. formulavalue(theVariable) failed to work in my first attempts. Maybe with more effort on my part it would have. But I did find another way to get where I needed to be by changing the blueprint of the Web Browser object. It’s plenty fast and works just fine.
Oh, I didn’t even notice that I typed it differently!
Obviously 3 lines isn’t overly complicated. But if you had to change a dozen objects, it adds up, and I know that many aren’t aware of the changeobject statement, which is new to Panorama X. So I wanted to point it out.