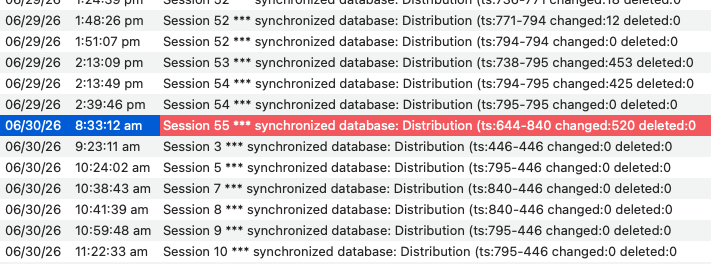
the 795 to 840 to 446 noted during synchronizing
An important distinction - these changes did not happen during synchronization.
In Panorama X, Synchronization does not modify the server database AT ALL. The client sends a request to the server saying “I was last synchronized at a time stamp of NN, please send me a copy of all database changes that have been made since NN”. The server collects all of the changes during the requested period, packages them up, and sends them back to the client. Then these changes are applied to the local client copy of the database. But the server copy of the database does not change in any way. This includes the time stamp on the server - synchronization doesn’t change that number.
Whenever any change is made on a client, the change is immediately sent to the server. The server copy of the database is updated with the change, and the time stamp is incremented. So the time stamp can only go up, and only by one number at a time. In your log the number appears to jump from 795 to 840 between 2:39 PM and 8:33 AM the next day, but that’s because 45 changes were made but no one synchronized during that period.
Based on the logs I would think there would have to have been TWO new sharing generations
I misread the log entries yesterday, there is only one spot where something unusual happened, between 8:34 AM and 9:23 AM. Somehow the time stamp went DOWN during this period, from 840 to 446. Also, apparently the server was stopped and restarted during this period.
The only scenario that I can imagine that would cause this would be:
- The server is shut down
- The copy of the database file on the server is manually replaced with an older copy of the file, for example someone restored a backup.
- The server is restarted, and the older copy of the file is loaded into memory.
Of course step 2 is pretty wild, but this would perfectly explain the log entries. The problem definitely occurred in the period where Panorama X Server.app was relaunched.
Yesterday I hypothesized about someone doing a new sharing generation, but that would not produce this sequence in the log. If a New Sharing Generation had been done, the time stamp would have gone from 840 to 1 (or possibly 0).
So I think the ONLY possible explanation is that somehow this database file was replaced with an older version of the file, and then the server was restarted. Once that happened, of course synchronization won’t work any more - the logs show that most of the clients had newer copies of the database than the server has. The synchronization code relies on the fact that the server is always newer or at least the same time stamp as all clients.
The first entry after the restart (9:23 AM) is interesting - this client also has the 446 time stamp. I believe that the server copy was already replaced, and then this client downloaded the database for the first time, so it got the out of date copy. It then immediately synchronized (this is normal), which is what we see in the log.
The numbers fit right in. The 644-840 do not.
No, this number is fine. The 840 is the time stamp on the server, which fits right in with the previous sequence of time stamps. The 644 simply means that that particular client hadn’t been synchronized for a while. At that point in time, any value from 0 to 840 would be valid for the time stamp on a client computer. A value of 0 would simply indicate that that client had never synchronized since the most recent new generation. Perhaps unlikely, but definitely possible (for example you could have made a copy after the new generation, and never touched that copy).
How the 446 seems to have worked its way in is also puzzling.
Yes, this is the key number, as I explained above.
unless there’s some strange
There is definitely something strange going on. At this point, I believe that somehow a database file has been swapped out behind Panorama’s back.
He’s going to unshare, clean it up, and reshare.
Was that not done immediately on the 30th?
If I download data, it pulls in 10,624 records. Syncing it returns it to 7995. Should this not be the same?
Of course it should be the same as long as everything is working fine. The only reason there is a Download Data command is for a case where everything his not working fine.
The Panorama X server system is designed such that the server always contains the correct, most up-to-date data. So normally using Download Data will insure that the client you downloaded to will now also contain the correct, most up-to-date data. Synchronizing should also accomplish this, but if the time stamps on the client got out of whack, it wouldn’t. This was particularly an issue during the Panorama X Server beta period. There haven’t been any “time stamp out of whack” issues reported in a while, so Download Data shouldn’t be necessary.
But if a database file on the server is changed behind Panorama’s back, all bets are off. Now the copy on the server is no longer the correct, most up-to-date version of the database. There is really nothing that Panorama’s code could do about something like this. Essentially Panorama has been sabotaged, perhaps not the best choice of words since I’m sure this wasn’t intentional, but the effect is the same.
At this point I would find the client copy that is the most recent, and use that to re-upload the database to the server. You can check the time stamp of a database by using the info(“serverrecordts”) function, you want the highest number. I would recommend disabling server connections on the client so that it doesn’t try to synchronize, which can be done in the Preferences>Client panel.

- Disable Server Connections
- Open database
- Check time stamp #
Once you’ve found the client with the highest time stamp, disconnect it from the server, then turn server connections back on and upload to the server.