I need some help adjusting the bottom of my chart.

As you can see from the image above my X-axis tags are truncated. I am charting a variable, and my variable contents are gathered with he following code:
fgChartVariance = ArraySelectedBuild(cr(), “”, {«AcctName» + tab() + «Variance»})
fgChartVariance = cr()+fgChartVariance +cr()+{“bottommargin”}+tab()+ {60}
Here is the actual contents of my variable:
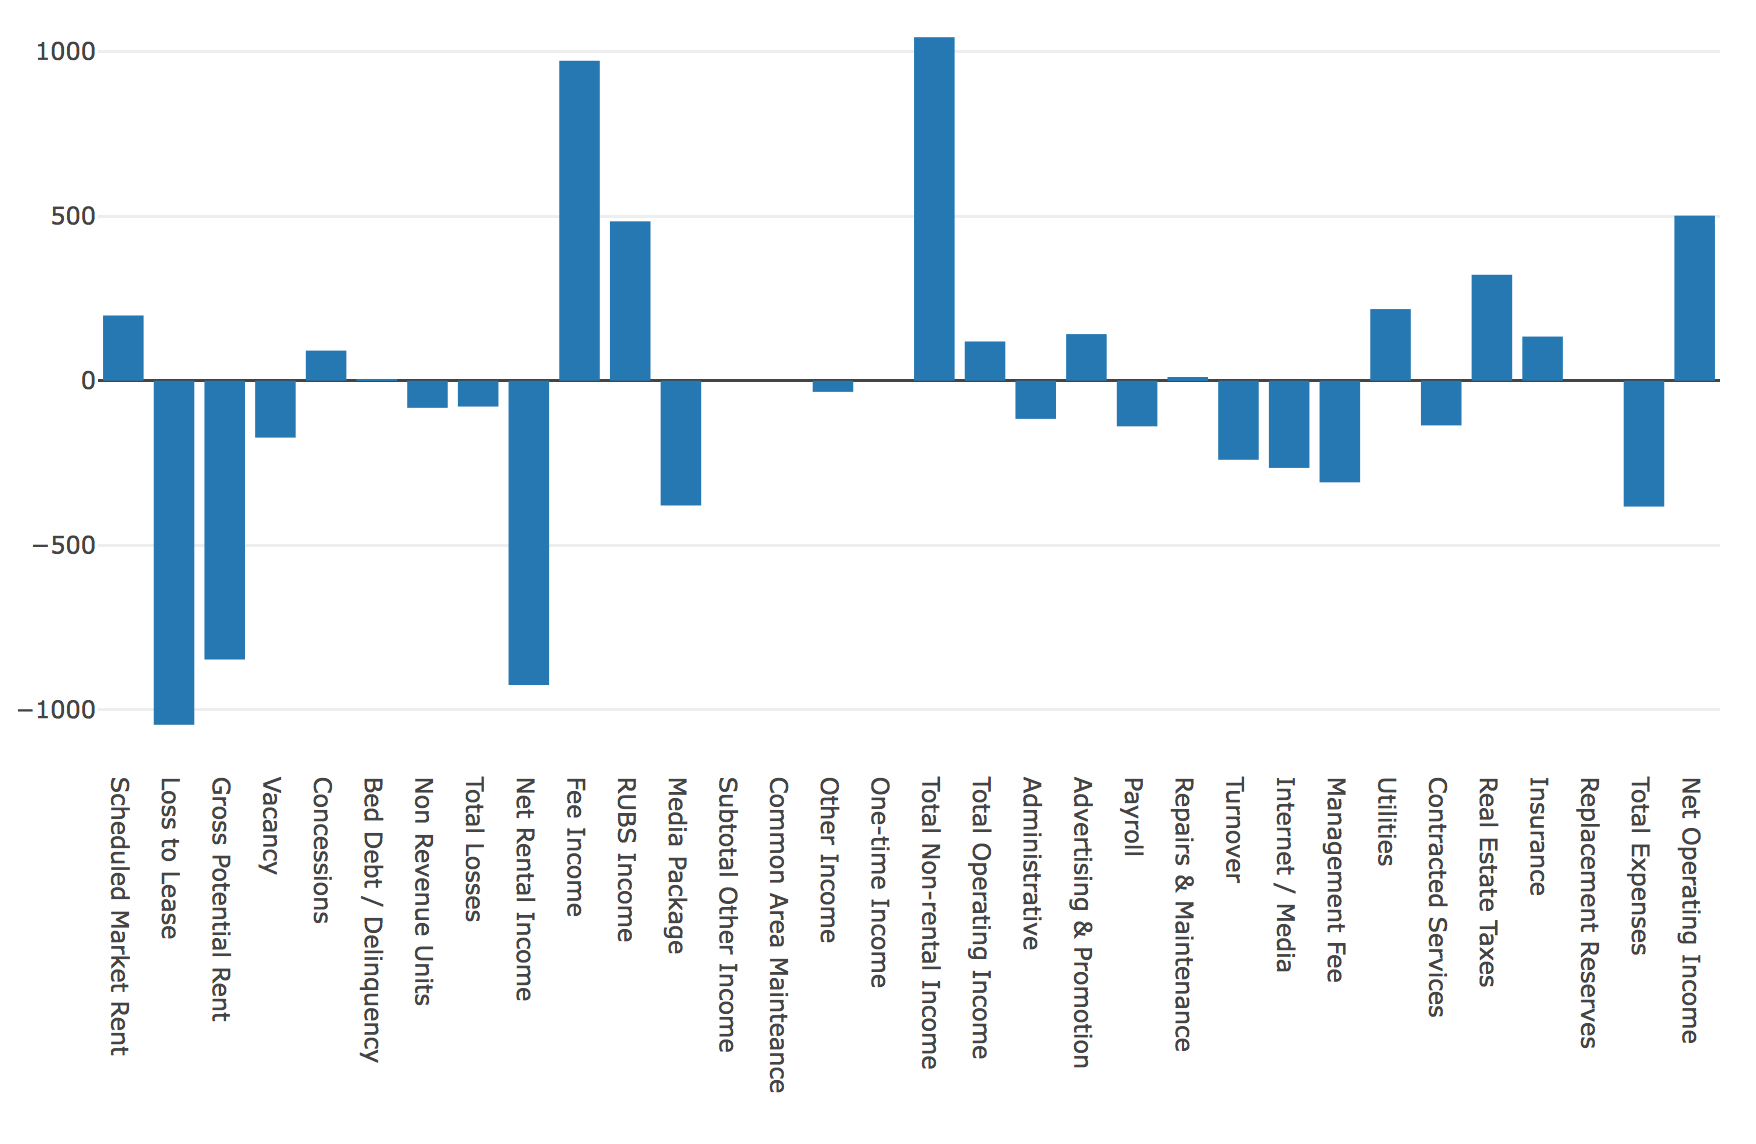
Scheduled Market Rent 198.2797455465006
Loss to Lease -1045.113967569221
Gross Potential Rent -846.8342220226987
Vacancy -172.684440454162
Concessions 91.54903485049171
Bed Debt / Delinquency 2.73517786561265
Non Revenue Units -82.30782959061901
Total Losses -78.40022773805799
Net Rental Income -924.3289829525002
Fee Income 971.985624035129
RUBS Income 484.220336570571
Media Package -378.886426592798
Subtotal Other Income 0
Common Area Mainteance 0
Other Income -33.7368421052632
One-time Income 0
Total Non-rental Income 1043.58269190763
Total Operating Income 119.2537089552006
Administrative -115.809280325841
Advertising & Promotion 141.7173967788202
Payroll -138.5186953237101
Repairs & Maintenance 5.657878313424987
Turnover -240.087711998948
Internet / Media -264.7860904601845
Management Fee -308.588604337972
Utilities 217.728225285494
Contracted Services -135.667064478338
Real Estate Taxes 321.9410289818579
Insurance 134.147427545356
Replacement Reserves 0
Total Expenses -382.2559972846602
Net Operating Income 501.509706239809
“bottommargin” 60
However, I can’t get the bottom margin to change. I assume I am making a syntax error someplace. Perhaps someone has better eyes than I have.